


Testimonials
Real stories from people we've had the pleasure of working with.


Our Product
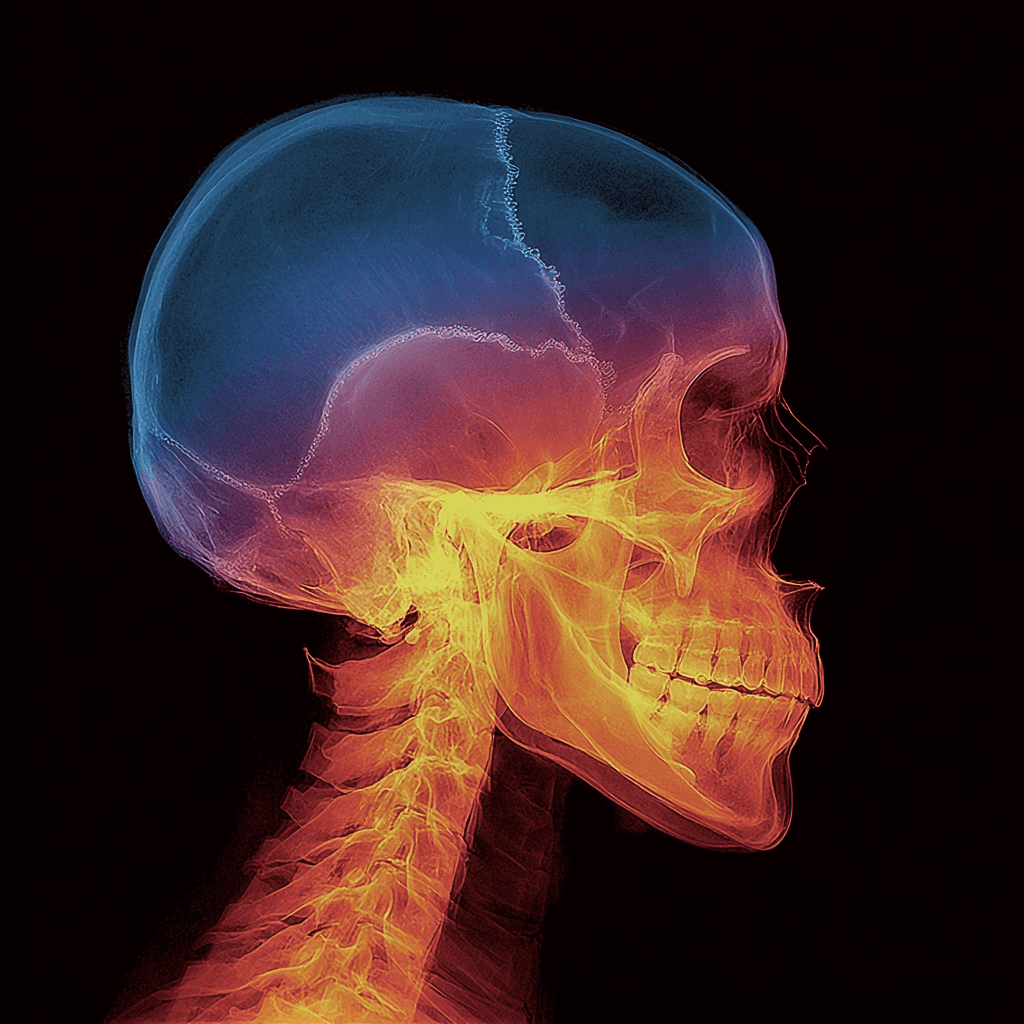
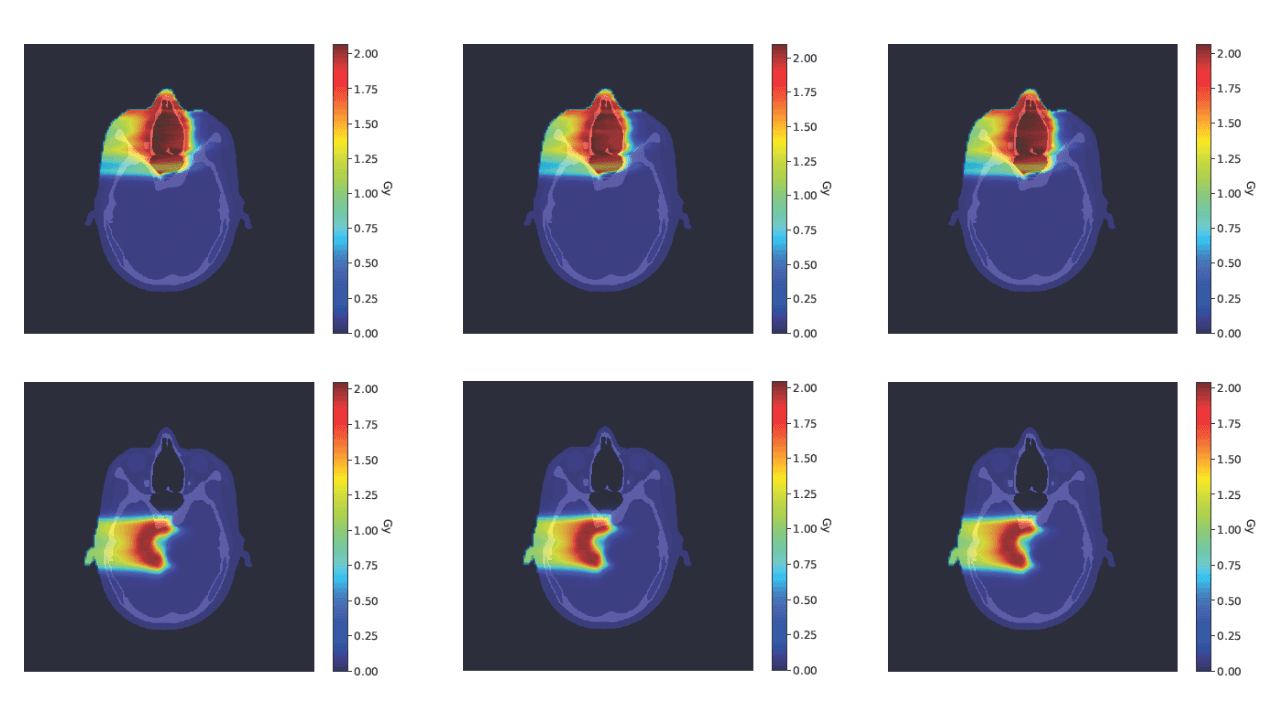
TissueXplorer™ SPR is a vendor-agnostic software that transforms spectral CT images from existing scanners into accurate stopping power maps.
TissueXplorer™ SPR
By providing high-resolution material maps, our software assists in therapy planning to align dose delivery with target volumes - supporting efforts to spare healthy tissue and critical structures.
Optmizing Margins, Expanding Possibilities
Accurate stopping power ratio (SPR) parametric maps provide material-related image information that is commonly considered during treatment planning workflows. TissueXplorer™ SPR provides complementary information that may support margin evaluation and assist clinicians in considering approaches intended to limit dose deposition in surrounding healthy tissue.
The few ways we contribute to diagnostics accuracy and developments.
TissueXplorer™ GEM
Gadolinium Enhancement Maps
By exploiting the energy-dependent attenuation of gadolinium, TissueXplorer™ GEM enables visualization of contrast enhancement patterns that may persist across imaging phases.
Importance of late gadolinium detection
Gadolinium enhancement parametric maps can be used to visualize differences in contrast agent retention by exploiting delayed washout behavior in regions with altered extracellular space. Following contrast administration, some tissue regions may demonstrate more persistent enhancement patterns across imaging phases, which in clinical practice are often evaluated in cardiovascular imaging workflows.
TissueXplorer™ ZeRo
Tissue density and composition
CT attenuation reflects both density and composition, yet their combined representation in conventional CT can obscure differences between tissues. TissueXplorer ZeRo is designed to leverage spectral data to present these components as independent maps.
* Visualizations are generated using a synthetic dataset provided by Duke University’s Center for Virtual Imaging Trials (CVIT).
Our analysis is designed to be compatible with spectral CT systems from multiple major vendors.
Our team is composed of young and driven professionals and industry veterans, necessary to deliver such a unique and groundbreaking product.


Find answers to commonly asked questions about our AI solutions and spectral X-ray imaging technology.